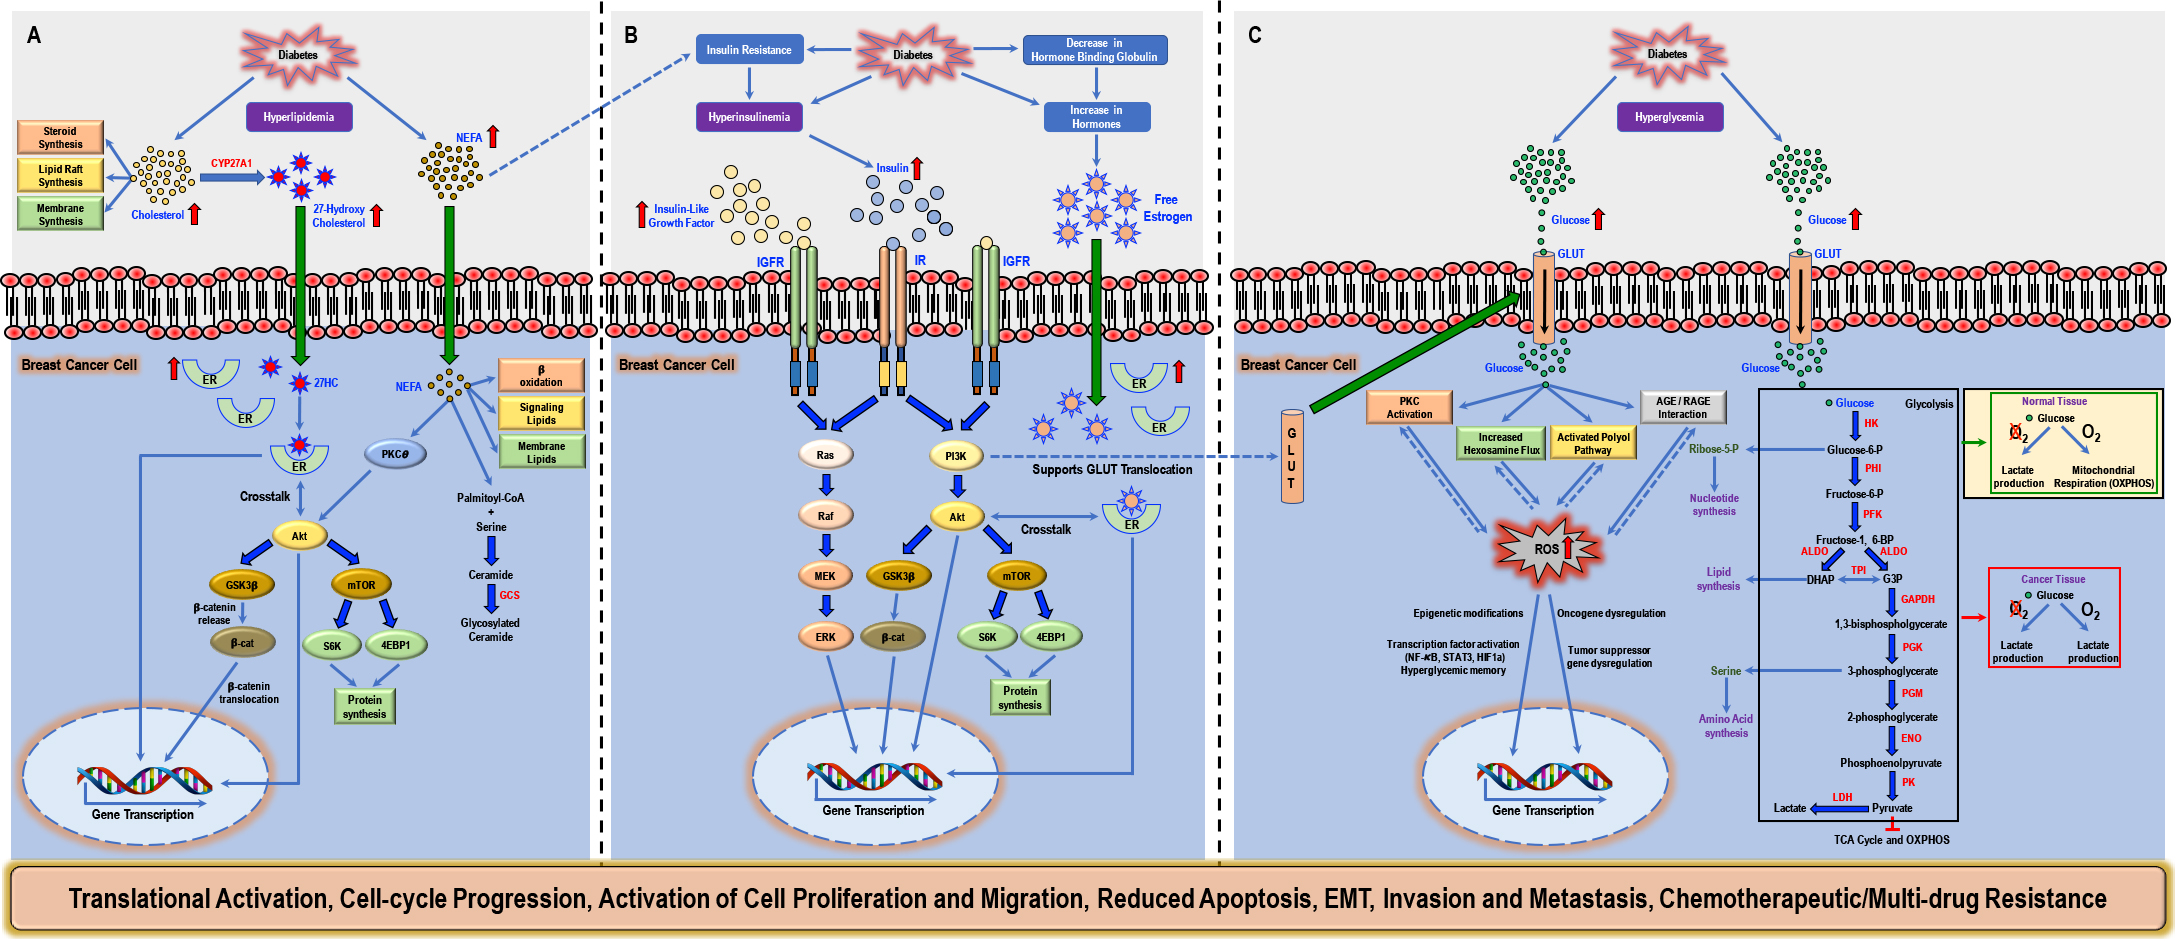
 Mechanisms and activated signal transduction pathways in diabetes associated breast cancer risk and progression. For details, please see publication at https://doi.org/10.1016/j.ctrv.2018.08.004
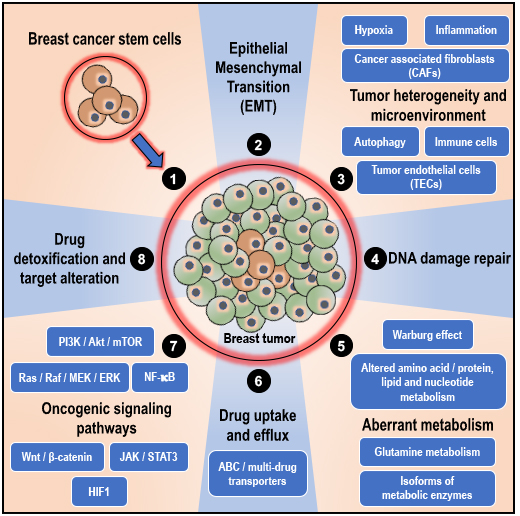
Mechanisms of chemoresistance in breast cancers. For details, please see publication at
https://doi.org/10.3390/cancers12092482
![Figure 1[1] Figure 1[1]](/LinkClick.aspx?fileticket=bnANOCPPu_0%3d&portalid=16)
Endothelial cell signaling in promoting tumor angiogenesis. For details, please see publication at
https://doi.org/10.3390/biom10020191
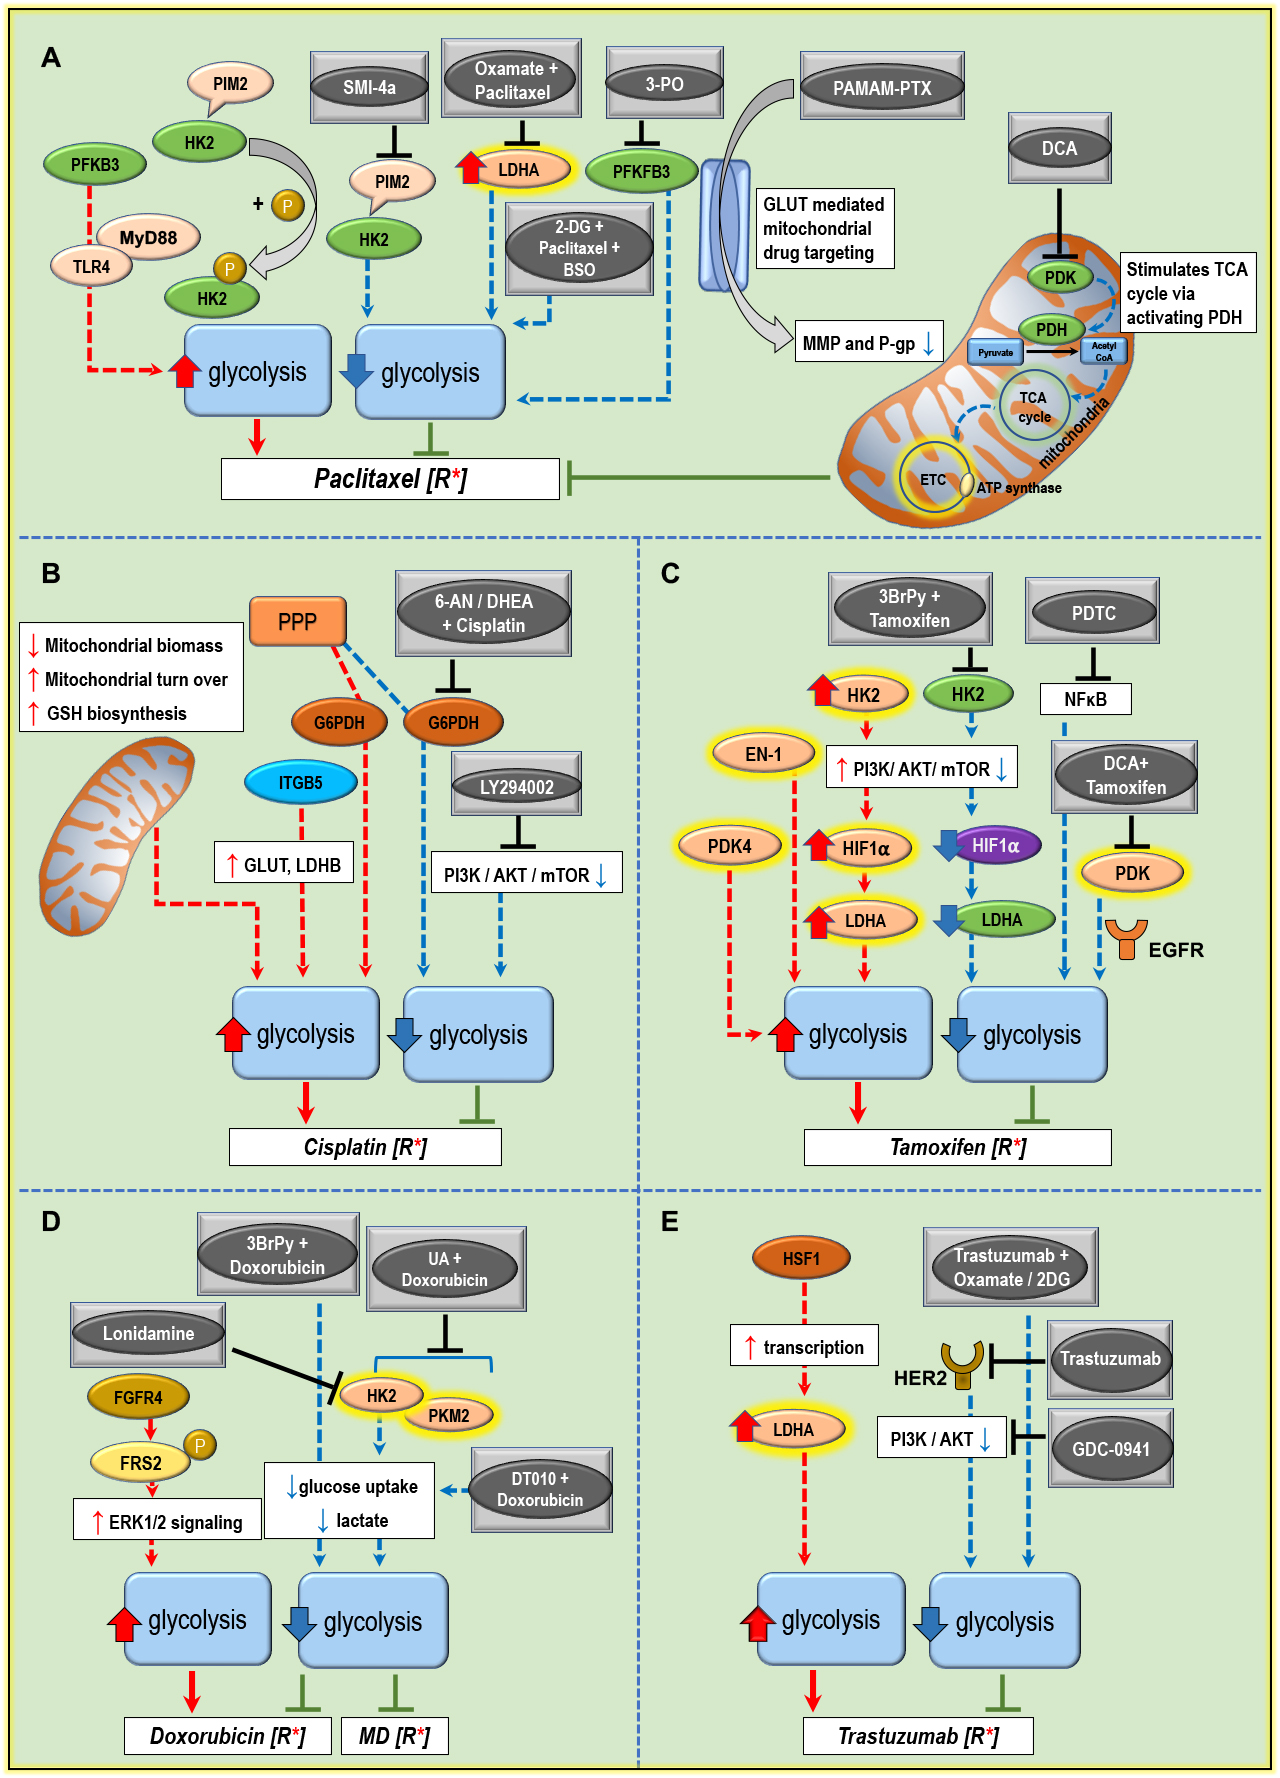
Metabolic components of drug resistance in breast cancer and anticancer drugs/or combinations treatment targeting tumor glucose metabolism. For details, please see publication at
https://doi.org/10.3390/cancers12082252
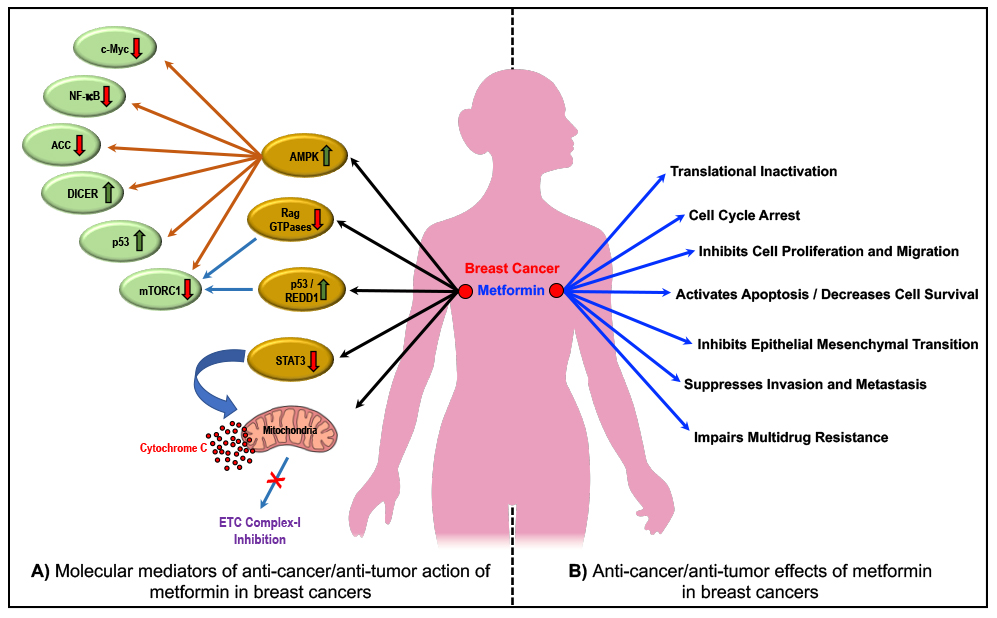
Molecular mediators (A) and effects (B) of the anti-cancer actions of metformin. For details, please see publication at
https://doi.org/10.3390/cancers12092482
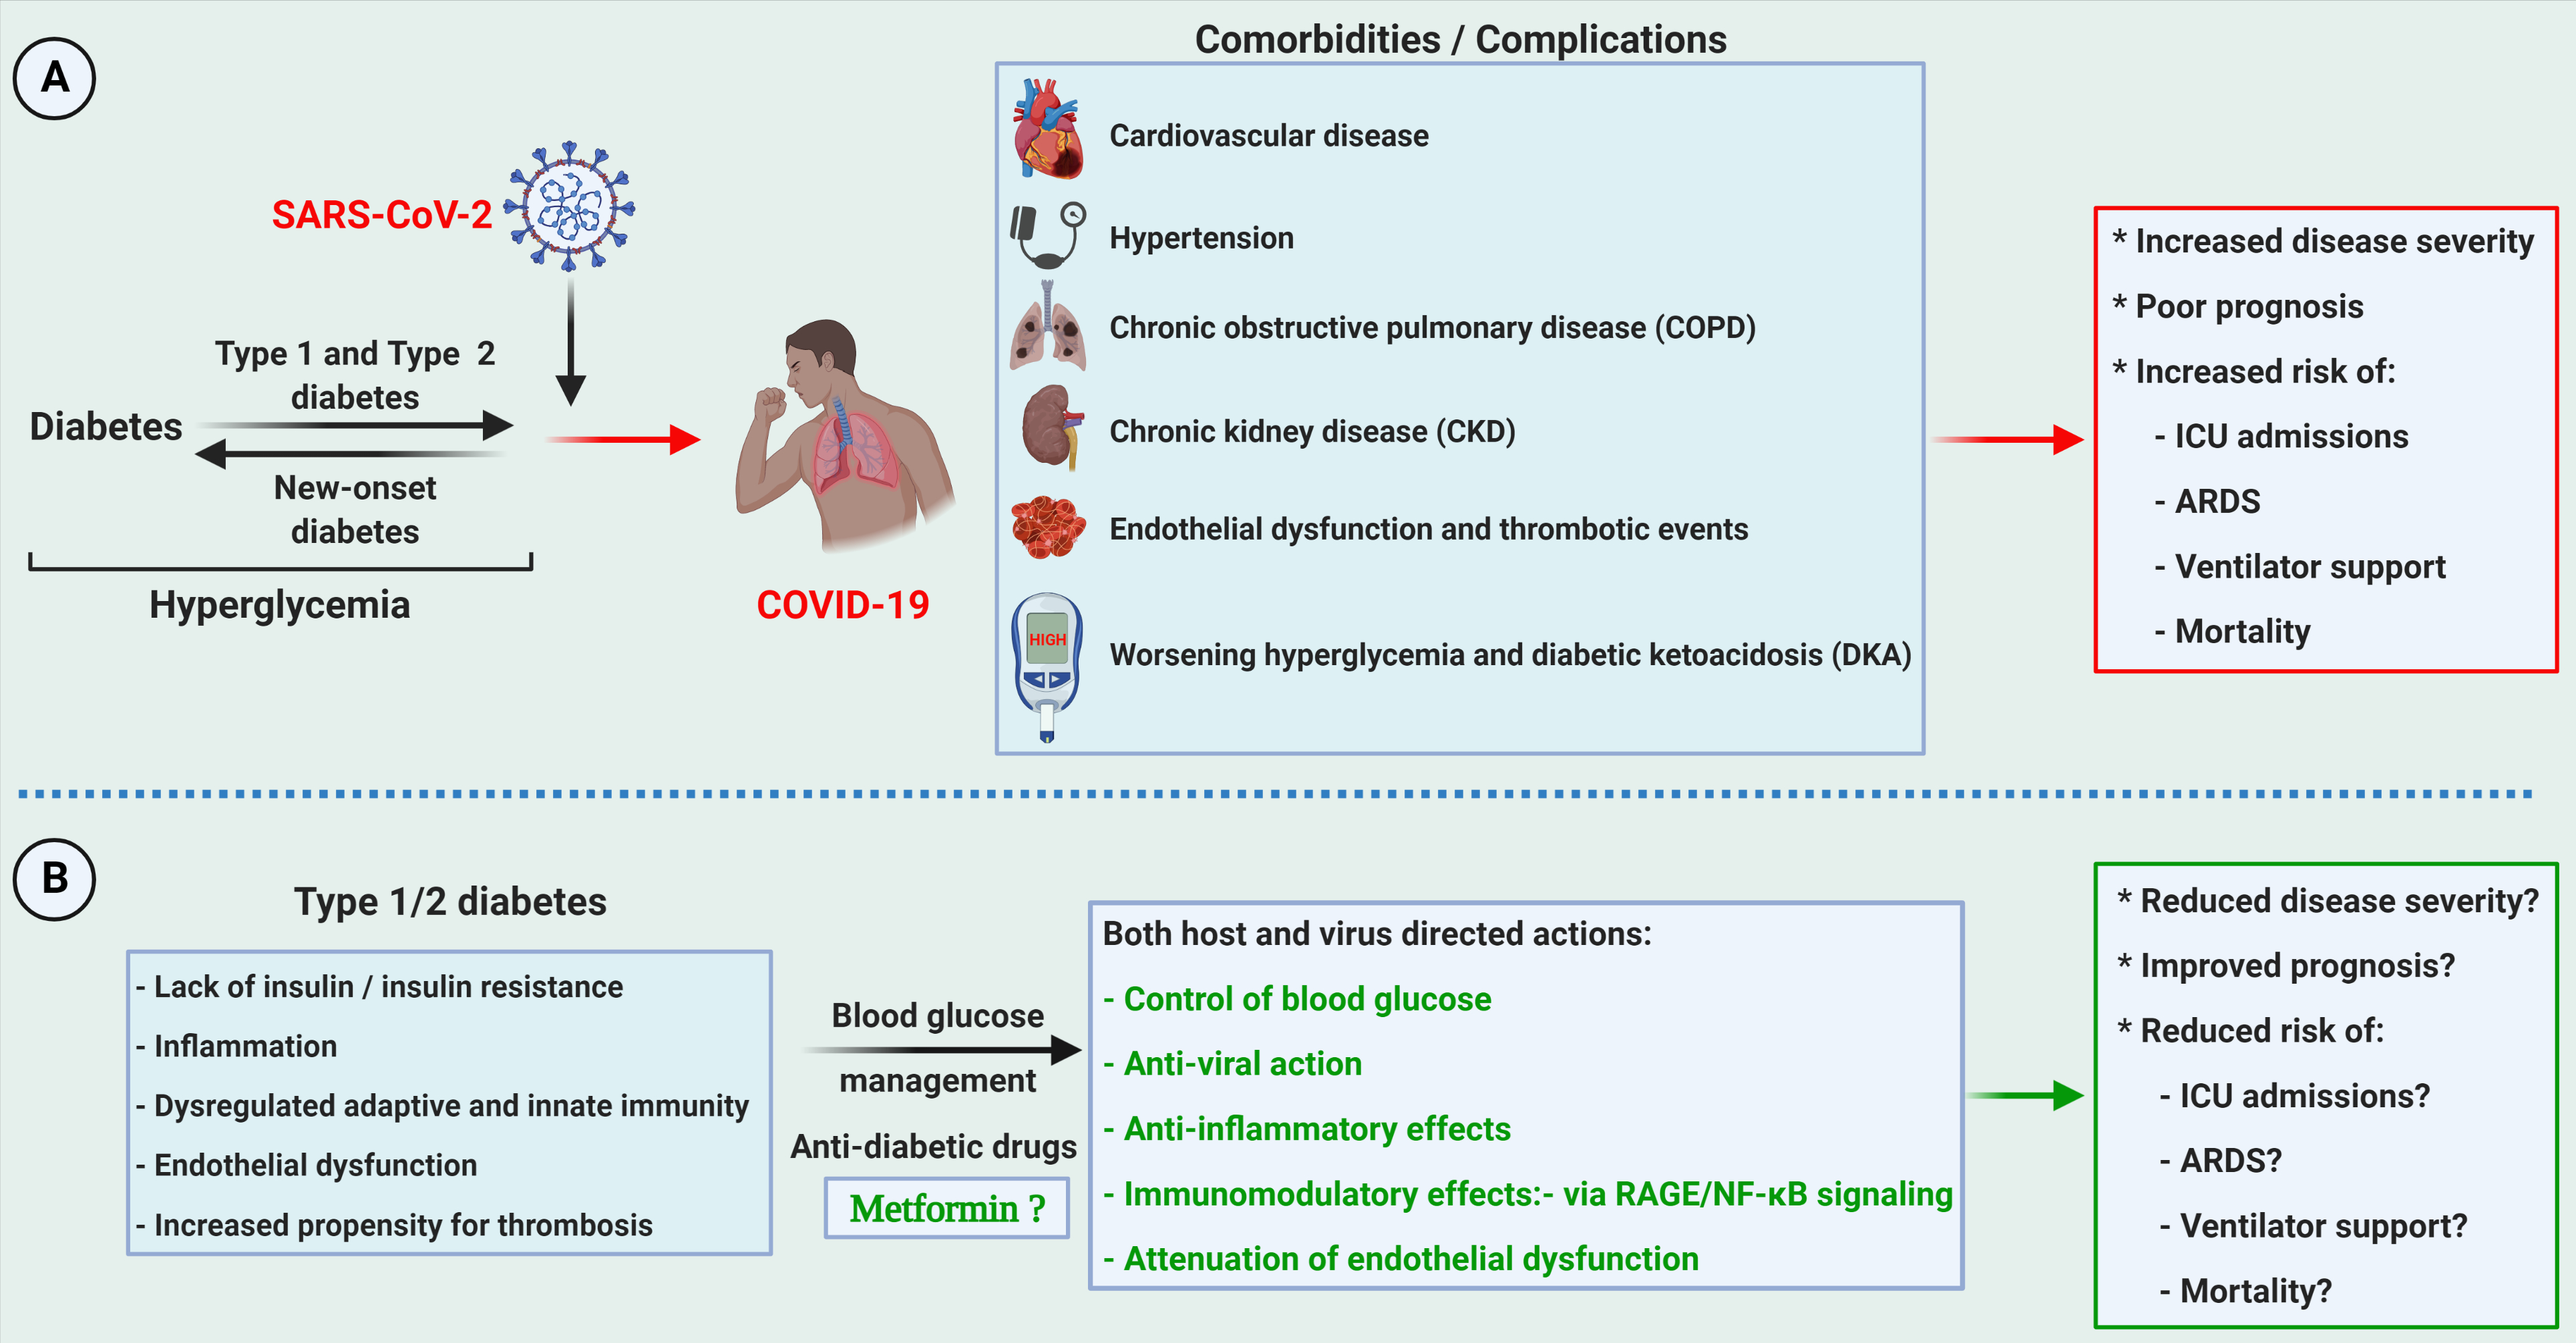 Bidirectional relationship of diabetes vs. COVID-19 and the potential benefits of the antidiabetic drug metformin. For details, please see publication at https://doi.org/10.1371/journal.ppat.1009634

RAAS/SARS-CoV-2 axis in exaggerated immune response and acute pancreatic injury. For details, please see publication at
https://doi.org/10.1371/journal.ppat.1009634
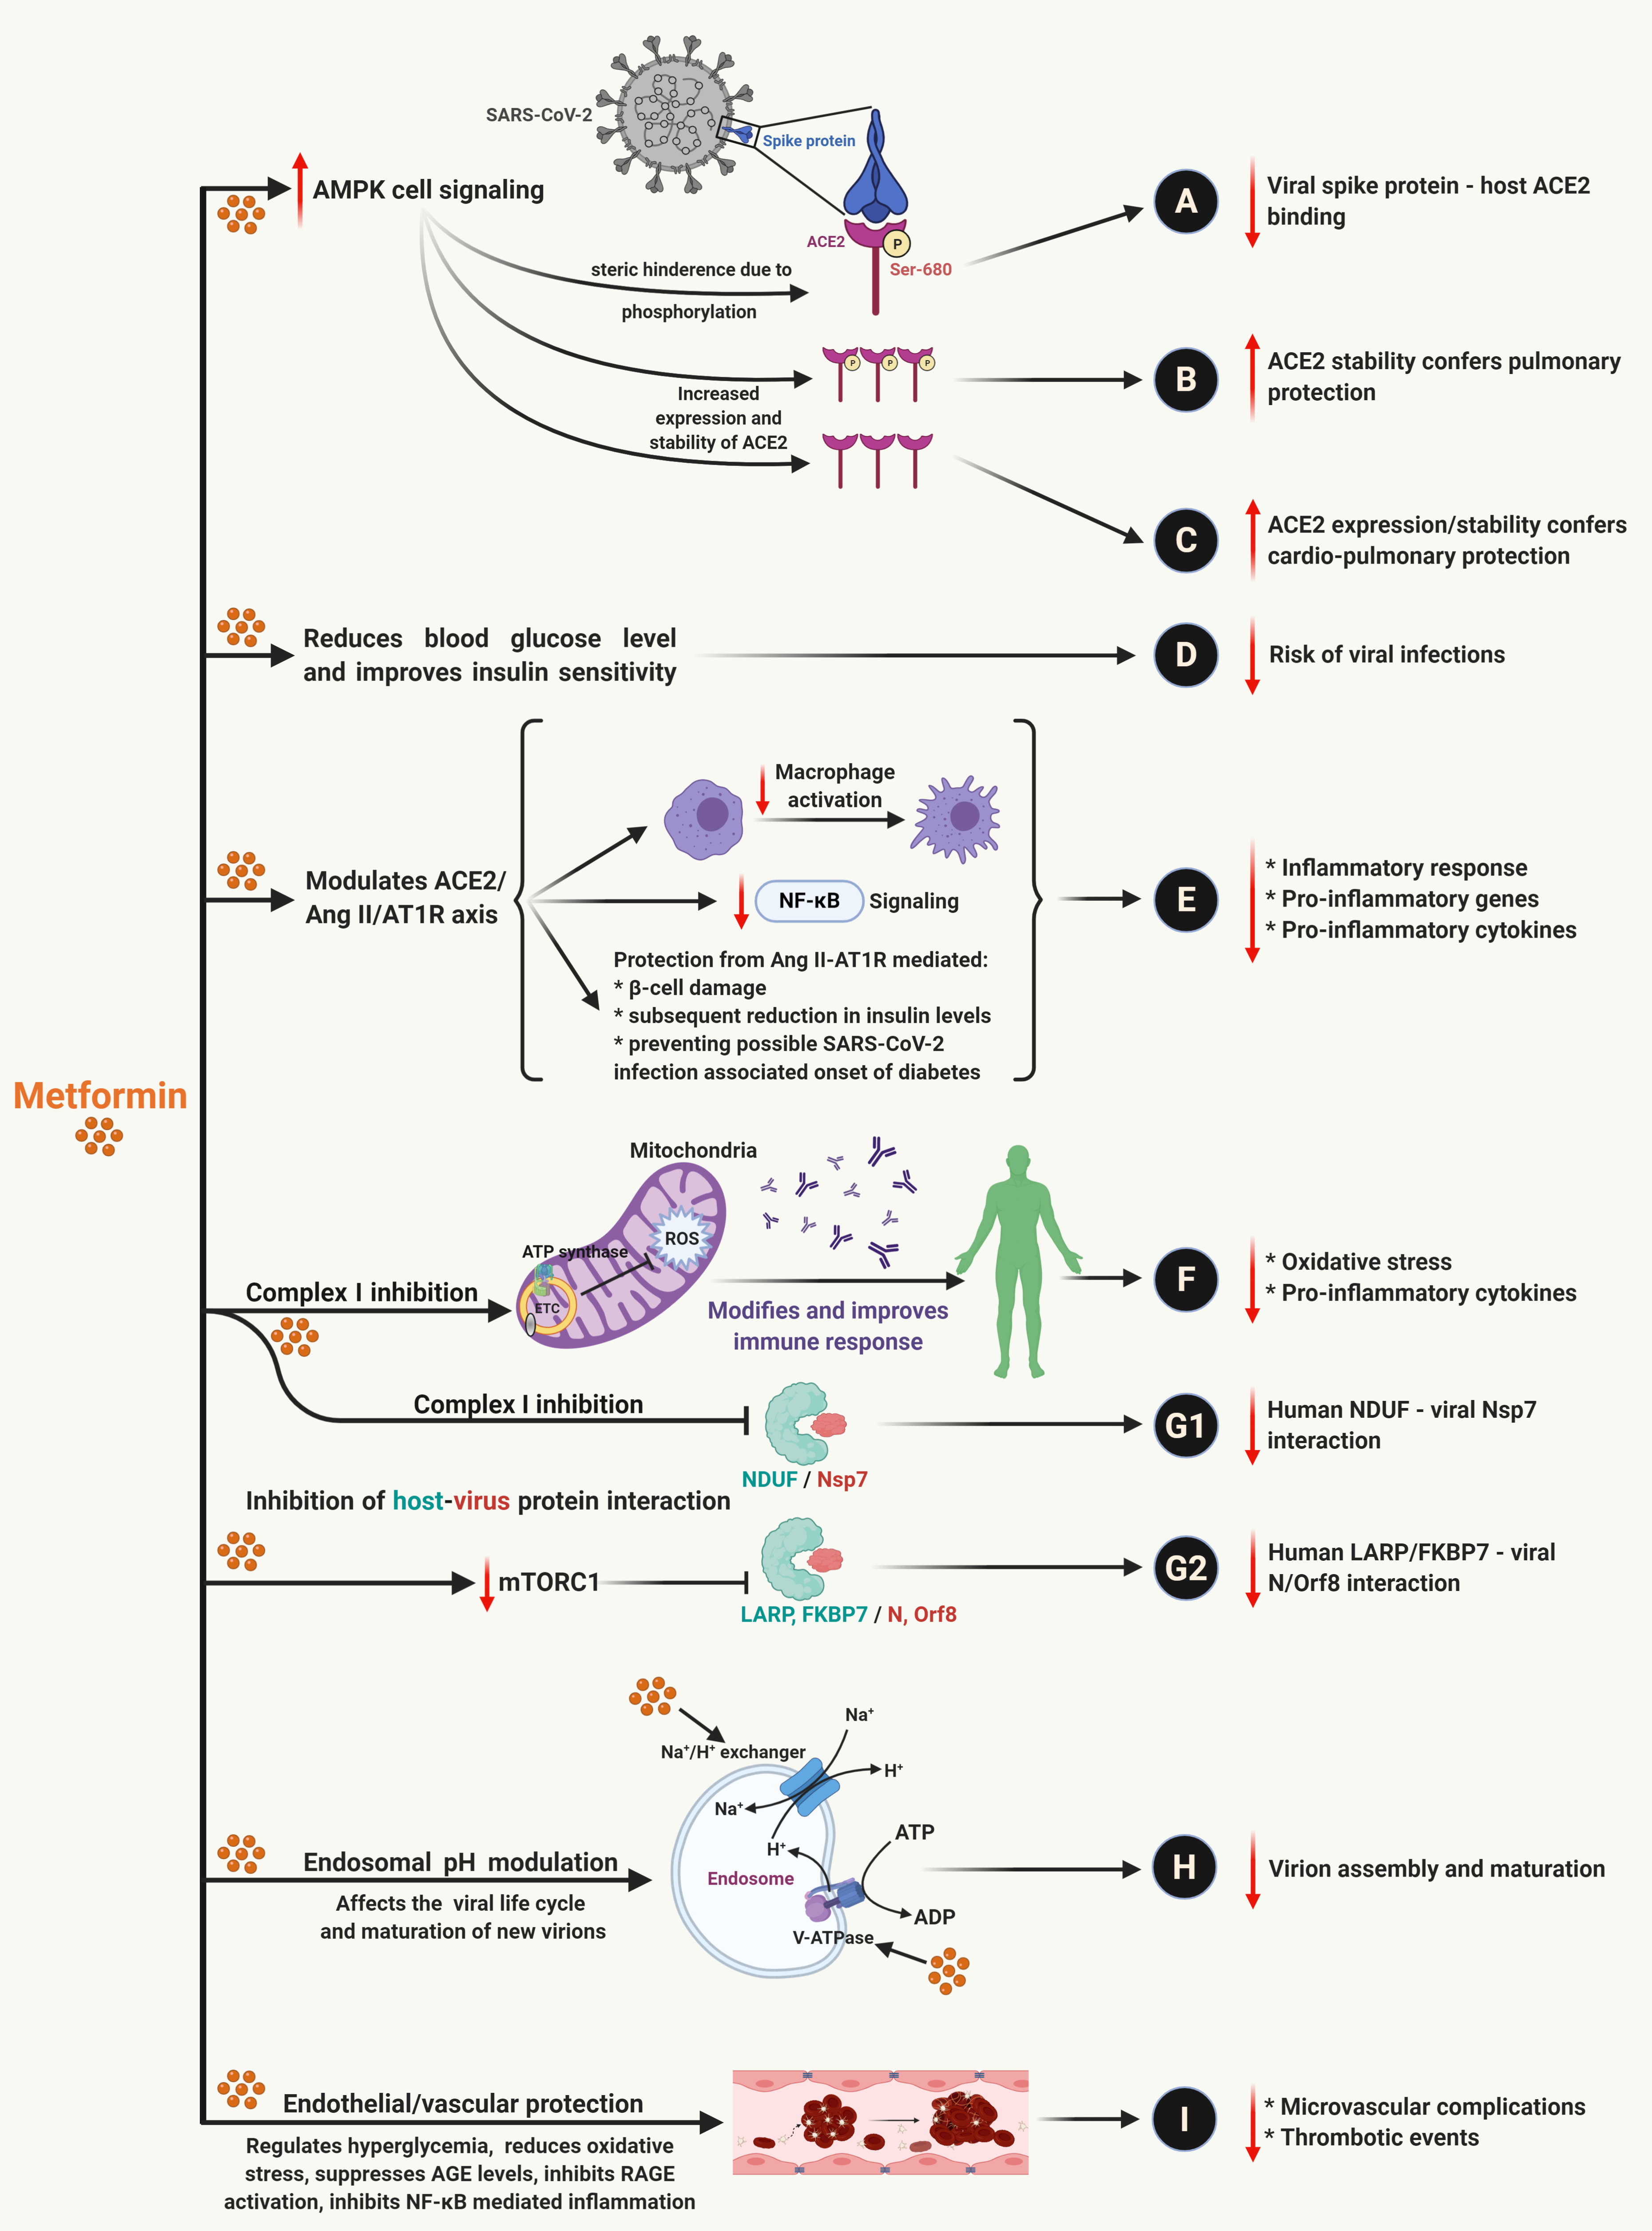 Multiple benefits of metformin treatment against SARS-CoV-2 infection. For details, please see publication at https://doi.org/10.1016/j.tim.2021.03.004
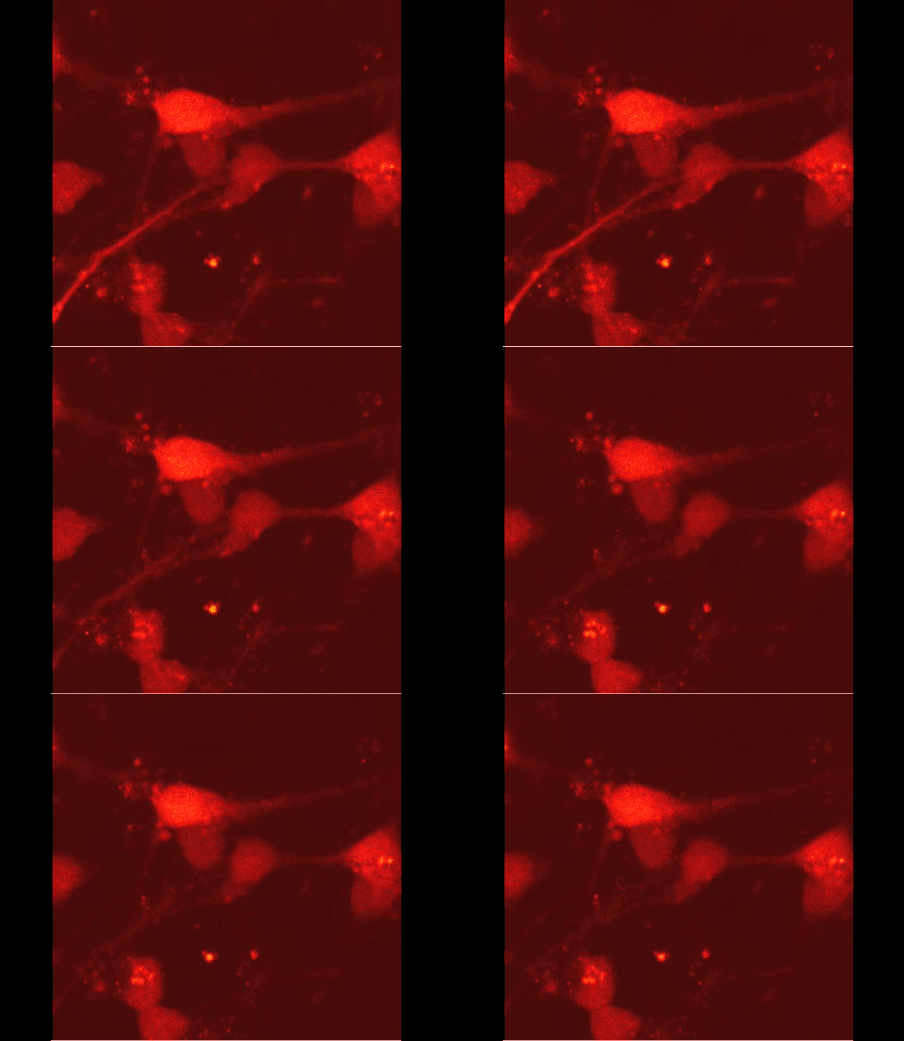
Ca2+-signals after the application of an anti-cancer drug